


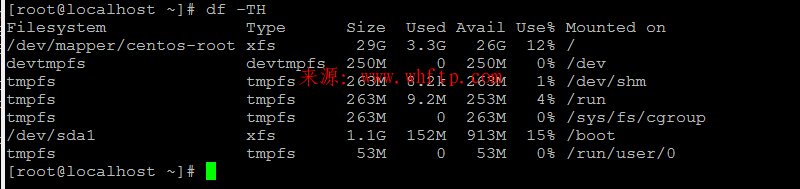
使用命令df -TH查看当前系统挂载的情况
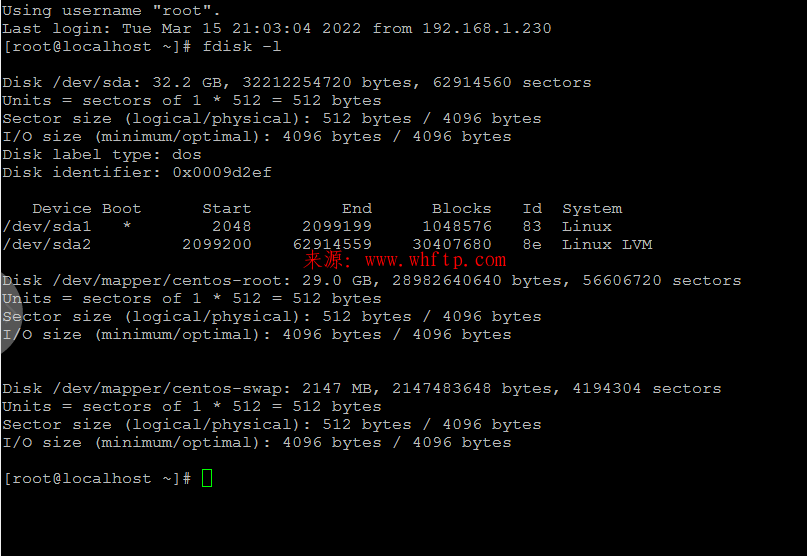
然后通过命令fdisk -l查看全部硬盘信息
可以看到 当前 只有系统磁盘
现在我 装了一块 120GB 磁盘
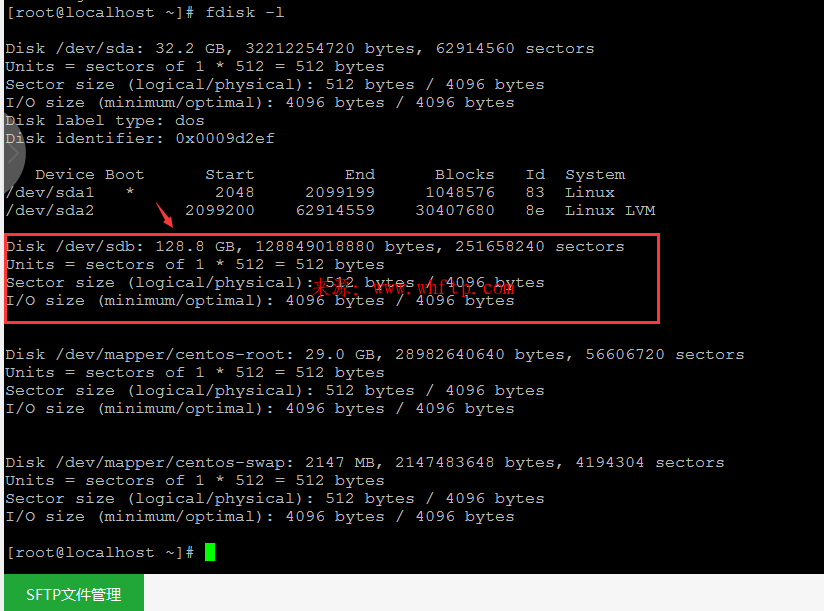
注意!注意!注意! fdisk /dev/盘符路径 根据自己的 路劲修改 、我的是 SDB 你的也可以是SDA SDC 等等...
注意!注意!注意! fdisk /dev/盘符路径 根据自己的 路劲修改、 我的是 SDB 你的也可以是SDA SDC 等等...
注意!注意!注意! fdisk /dev/盘符路径 根据自己的 路劲修改、 我的是 SDB 你的也可以是SDA SDC 等等...
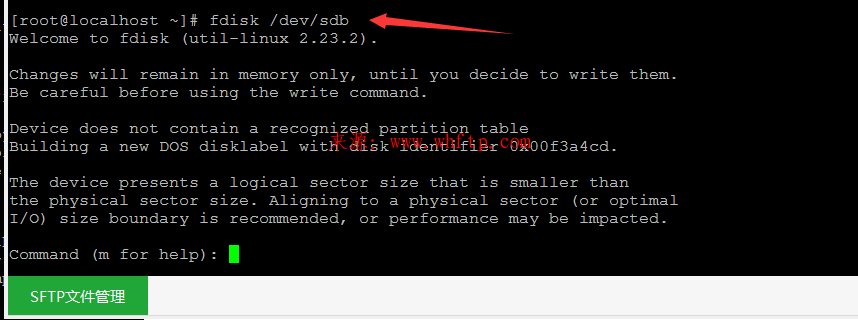
现在开始 执行挂载 数据磁盘
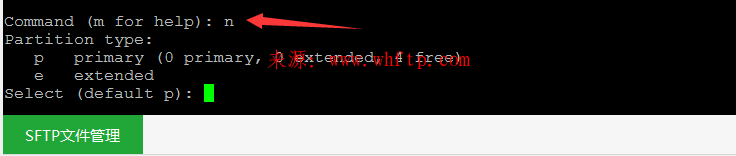
执行命令 fdisk /dev/sdb,进入fdisk模式,开始对新增数据盘执行分区操作
接下来输入
n
p
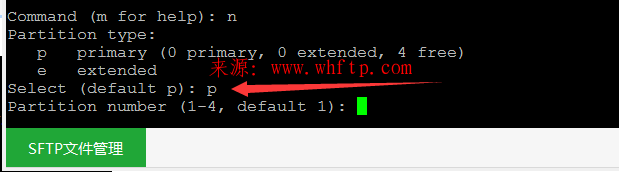
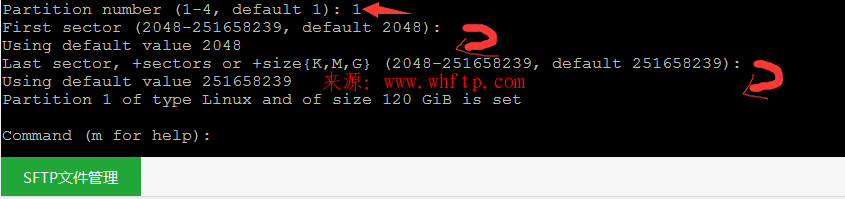
1 分一个盘 然后 回车2次
接着输入 w 保存,将分区结果写入分区表中。
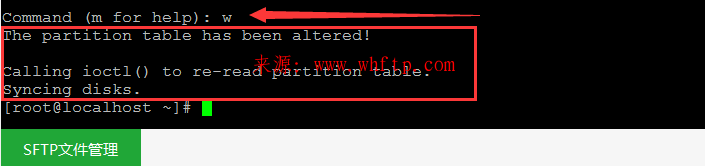
如回显信息如下,则说明分区成功:
The partition table has been altered!
Calling ioctl() to re-read partition table.
Syncing disks.
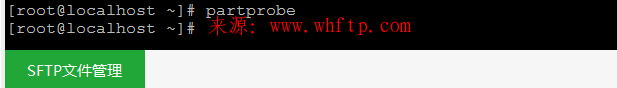
执行命令 partprobe 将新的分区表变更同步至操作系统。
执行以下命令,将新建分区文件系统设为系统所需格式。
mkfs -t ext4 /dev/sdb 在输入 y 回车 确定
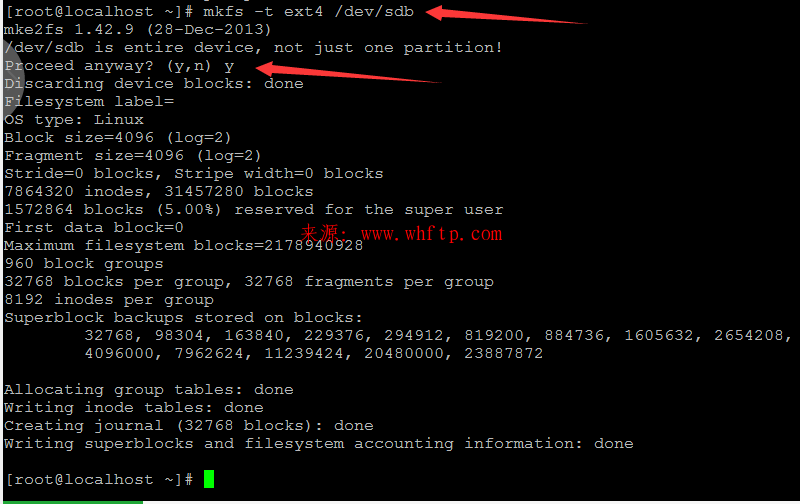
输入完后 等待 完成
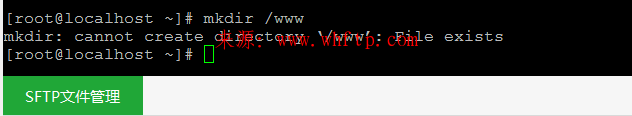
5、新建的一个挂载点,即目录,如果目录不存在要提前新建好,否则开机将可能失败
也可以根据自己需求 设置新建挂载目录。本处默认 WWW
mkdir /www 这个命令为: 新建一个 www 目录
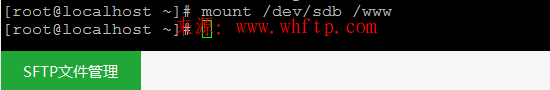
mount /dev/sdb /www 这个命令为: 将 /dev/sdb 挂载到 /www 目录
编辑开机启动项目 命令 如下:
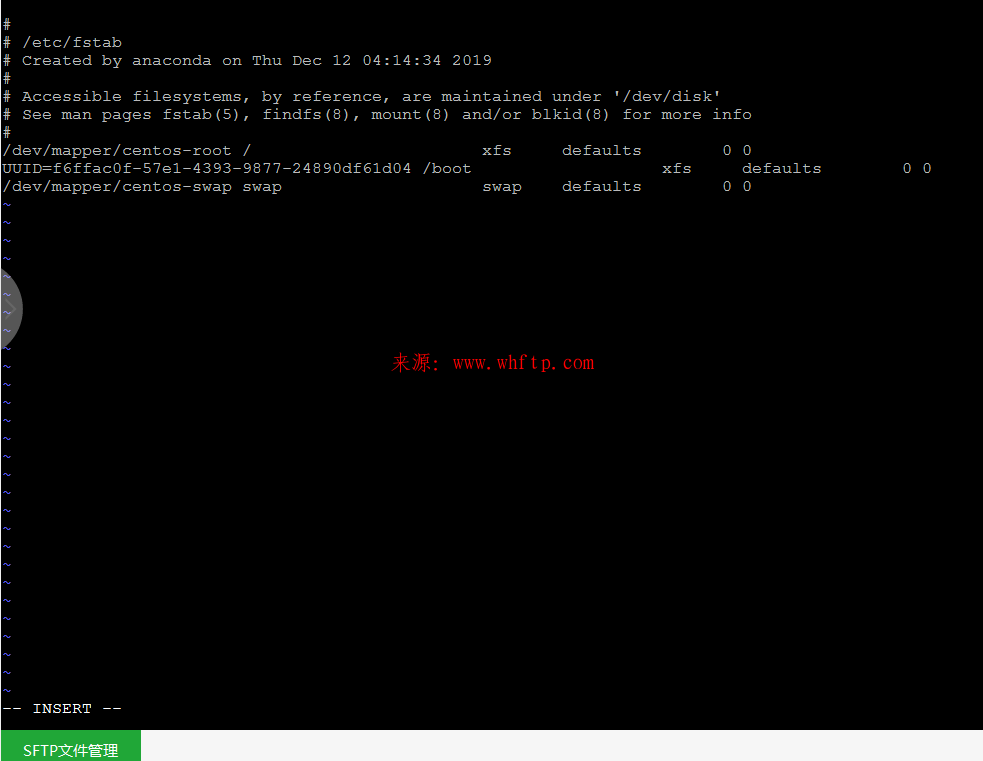
vi /etc/fstab
进入后按 i
使用键盘方向键 将光标移动到 最后一行 结尾 也就是 0 的后面 在按一下 回车 就跳到下一行了 ,
/dev/sdb /www ext4 defaults 1 2
在把 数据盘 添加上去 设置为开机挂载
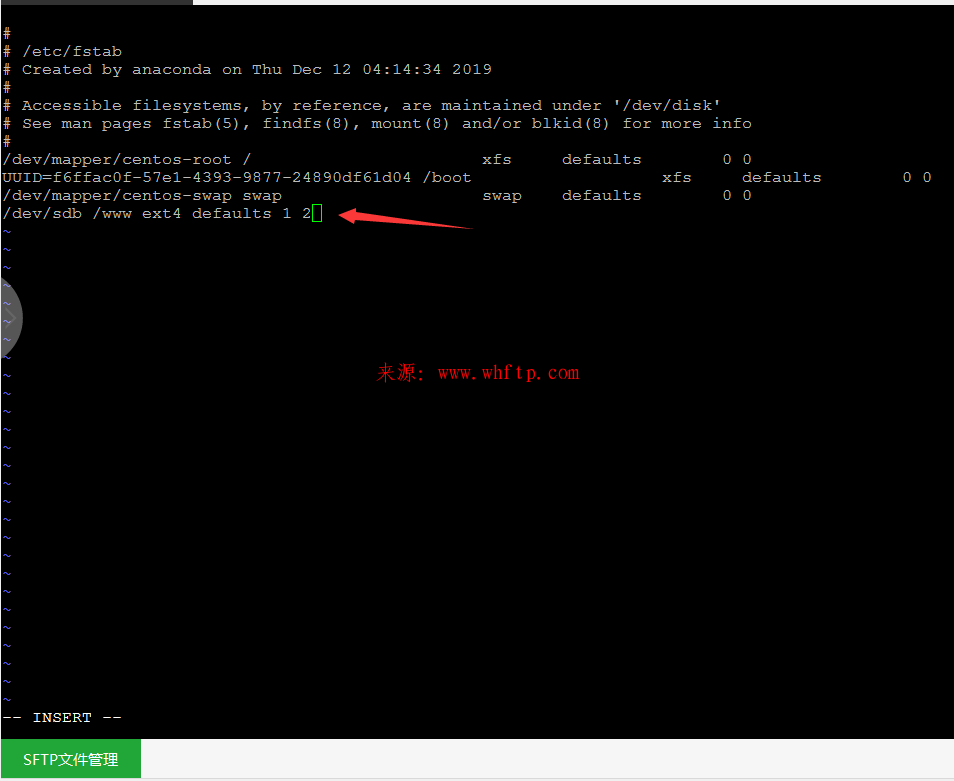
输入完
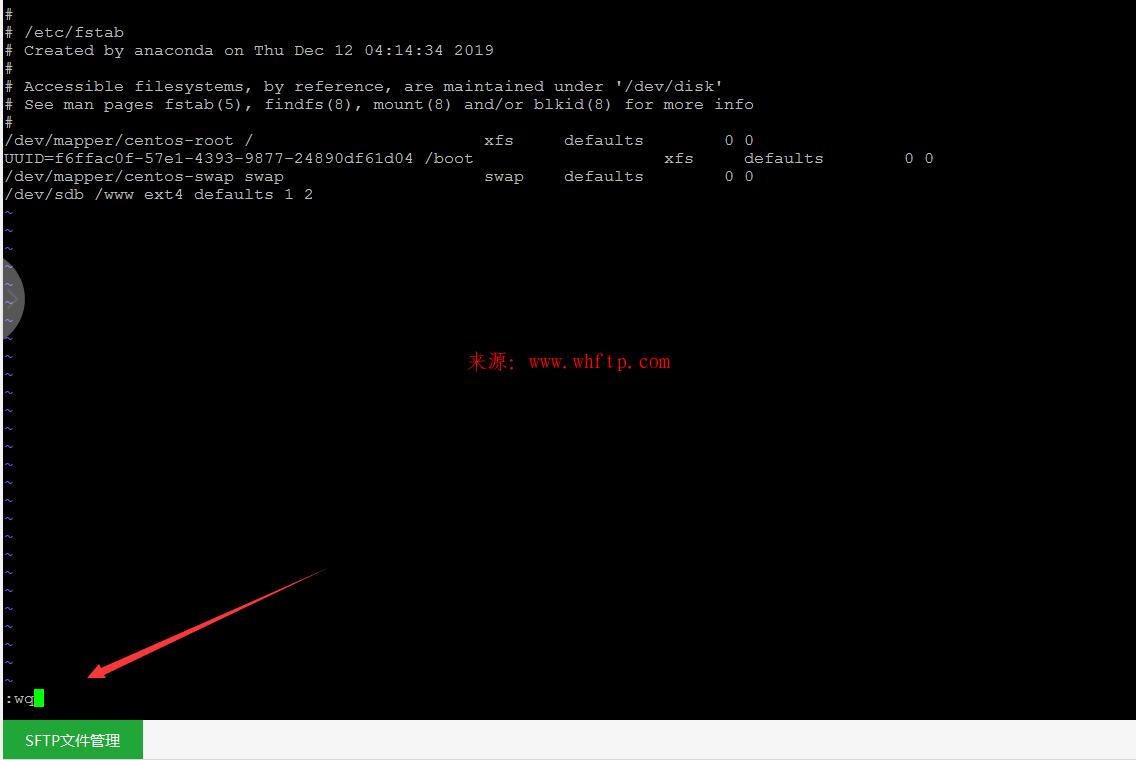
按 键盘 左上角 Esc 后 在输入
在输入 :wq 回车 ,保存退出
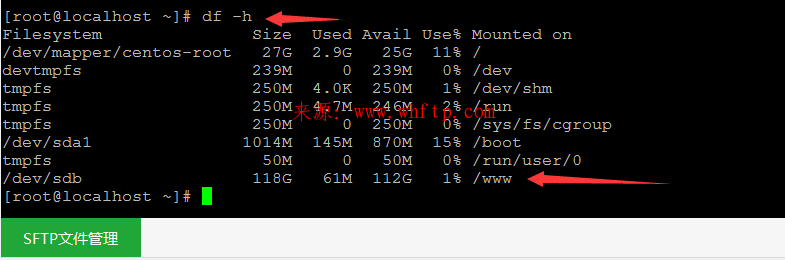
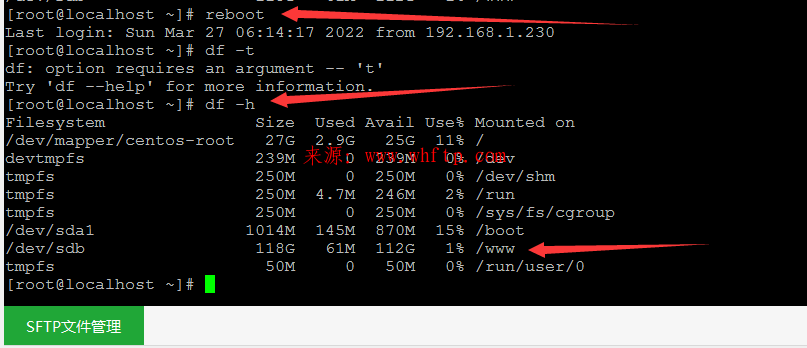
使用 df -h 命令 查看下 挂载情况
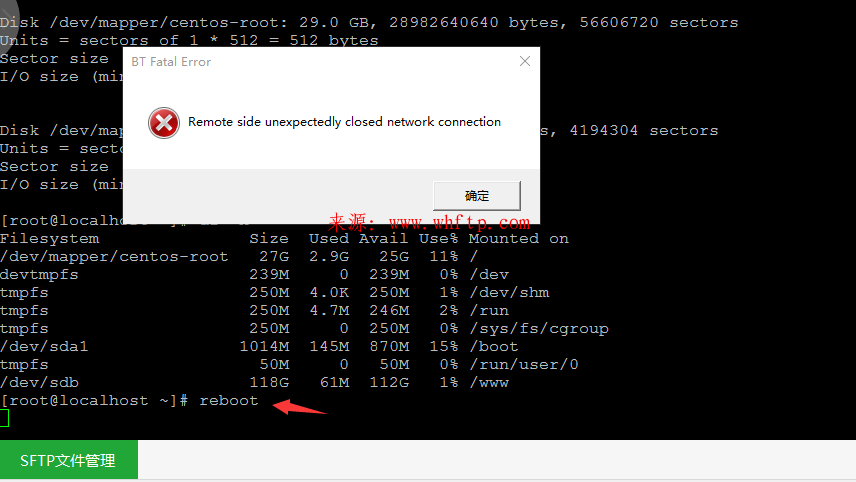
最后 reboot 重启
等待 重启 完成 查看 是否 挂载成功

可以看到 已经开机 自动 将数据盘挂载成功


fdisk  常用命令:
        n:创建新分区
        d:删除已有分区
        t:修改分区类型
        l:查看所有支持的类型
            p:显示现有分区信息
        w:保存并退出
        q:不保存并退出
        m:查看帮助信息
vi /etc/fstab 快速移动
连续 回车 可移动到 最后一行
在按 shift +$ 移动到 结尾最后一个字符 , 在 按 i 在按一次 方向键 右 在按 回车既可 跳转到新空白行
如果不习惯 请 直接 按 i 进入 编辑
yum -y install wget;wget http://kangle.cccyun.cn/start;sh star